
Page 54 - Demo
P. 54
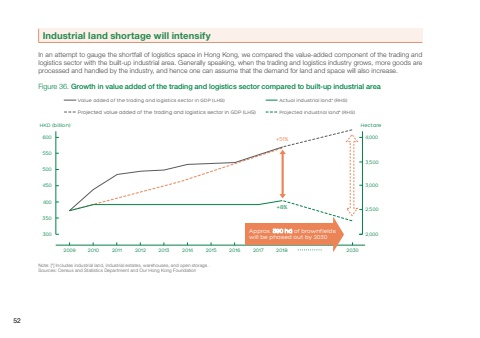
+8%+51%Note: [*] Includes industrial land, industrial estates, warehouses, and open storage.Sources: Census and Statistics Department and Our Hong Kong FoundationFigure 36. Growth in value added of the trading and logistics sector compared to built-up industrial areaProjected value added of the trading and logistics sector in GDP (LHS)Value added of the trading and logistics sector in GDP (LHS) Actual industrial land* (RHS)Projected industrial land* (RHS)2009 2010 2011 2012 2013 2014 2015 2016 2017 2018 2030Approx. 390 ha of brownfieldswill be phased out by 2030 300350400450500550600HKD (billion) Hectare4,0003,5003,0002,5002,000In an attempt to gauge the shortfall of logistics space in Hong Kong, we compared the value-added component of the trading and logistics sector with the built-up industrial area. Generally speaking, when the trading and logistics industry grows, more goods are processed and handled by the industry, and hence one can assume that the demand for land and space will also increase.Industrial land shortage will intensify52
