
Page 30 - Demo
P. 30
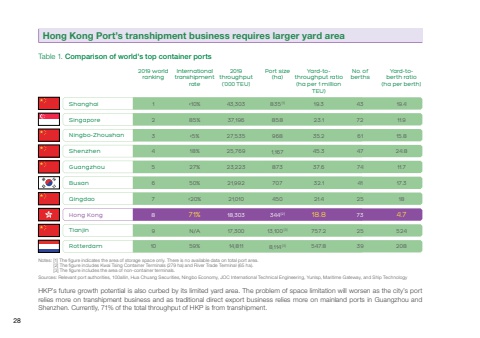
Table 1. Comparison of world's top container ports[1] The figure indicates the area of storage space only. There is no available data on total port area.[2] The figure includes Kwai Tsing Container Terminals (279 ha) and River Trade Terminal (65 ha).[3] The figure includes the area of non-container terminals.Sources: Relevant port authorities, 100allin, Hua Chuang Securities, Ningbo Economy, JOC International Technical Engineering, Yunlsp, Maritime Gateway, and Ship TechnologyNotes:12345678910<10
%<5'P%<20q%N/A59C,30337,19627,53525,76923,22321,99221,01018,30317,30014,811835[1]8589681,167873707450344[2]13,100[3]8,114[3]19.323.135.245.337.632.121.418.8757.2547.8ShanghaiSingaporeNingbo-ZhoushanShenzhenGuangzhouBusanQingdaoHong KongTianjinRotterdam4372614774412573253919.411.915.824.811.717.3184.75242082019throughput(’000 TEU)2019 worldrankingInternationaltranshipmentrateYard-tothroughput ratio(ha per 1 millionTEU)No. ofberthsPort size(ha)Yard-toberth ratio(ha per berth)HKP’s future growth potential is also curbed by its limited yard area. The problem of space limitation will worsen as the city’s port relies more on transhipment business and as traditional direct export business relies more on mainland ports in Guangzhou and Shenzhen. Currently, 71% of the total throughput of HKP is from transhipment. Hong Kong Port’s transhipment business requires larger yard area28
