
Page 39 - Demo
P. 39
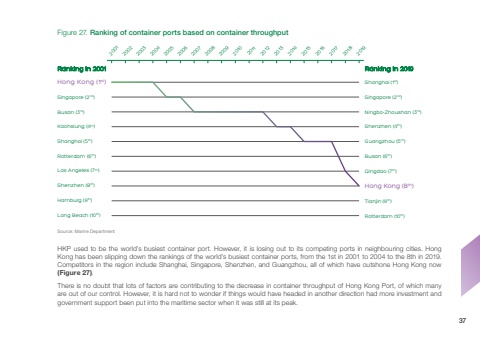
Figure 27. Ranking of container ports based on container throughputSource: Marine Department2001200220032004200520062007200820092010201120122013201420152016201720182019Ranking in 2001Hong Kong (1st)Singapore (2nd)Busan (3rd)Kaohsiung (4th)Shanghai (5th)Rotterdam (6th)Los Angeles (7th) Shenzhen (8th)Hamburg (9th)Long Beach (10th)Ranking in 2019Shanghai (1st)Singapore (2nd)Ningbo-Zhoushan (3rd)Shenzhen (4th)Guangzhou (5th)Busan (6th)Qingdao (7th)Hong Kong (8th)Tianjin (9th)Rotterdam (10th)HKP used to be the world’s busiest container port. However, it is losing out to its competing ports in neighbouring cities. Hong Kong has been slipping down the rankings of the world’s busiest container ports, from the 1st in 2001 to 2004 to the 8th in 2019. Competitors in the region include Shanghai, Singapore, Shenzhen, and Guangzhou, all of which have outshone Hong Kong now (Figure 27). There is no doubt that lots of factors are contributing to the decrease in container throughput of Hong Kong Port, of which many are out of our control. However, it is hard not to wonder if things would have headed in another direction had more investment and government support been put into the maritime sector when it was still at its peak.37
