
Page 60 - Demo
P. 60
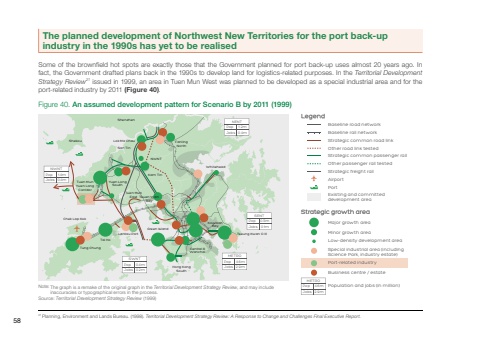
METRO4.6m2.9mPopJobsFigure 40. An assumed development pattern for Scenario B by 2011 (1999)Baseline road networkBaseline rail networkStrategic common road linkOther road link testedStrategic common passenger railOther passenger rail testedStrategic freight railAirportPortExisting and committeddevelopment areaMajor growth areaMinor growth areaLow-density development areaSpecial industrial area (including Science Park, industry estate)Port-related industryBusiness centre / estatePopulation and jobs (in million)Strategic growth area SENT0.5m0.1mPopJobsMETRO4.6m2.9mPopJobsNENT1.2m0.4mPopJobsNWNT1.4m0.4mPopJobsSWNT0.4m0.2mPopJobsShekouShenzhenCentral &WanchaiKowloonBayHong KongSouthTseung Kwan O IIIGreen IslandLantau PortTung ChungTai HoChek Lap KokWhiteheadYuen LongSouthFanlingNorthTuen MunEast Tsuen WanBayNWNTKam TinSan TinTuen MunYuen LongCorridorLok Ma ChauSource: Territorial Development Strategy Review (1999)The graph is a remake of the original graph in the Territorial Development Strategy Review, and may include inaccuracies or typographical errors in the process. Note: LegendSome of the brownfield hot spots are exactly those that the Government planned for port back-up uses almost 20 years ago. In fact, the Government drafted plans back in the 1990s to develop land for logistics-related purposes. In the Territorial Development Strategy Review21 issued in 1999, an area in Tuen Mun West was planned to be developed as a special industrial area and for the port-related industry by 2011 (Figure 40).The planned development of Northwest New Territories for the port back-up industry in the 1990s has yet to be realised21 Planning, Environment and Lands Bureau. (1998). Territorial Development Strategy Revie A Response to Change and Challenges Final Executive Report.58
